@JGStew
Debug Bigfix Dashboard In Visual Studio
Objectives:
- View JavaScript Console Output in Visual Studio
- View HTML currently rendered in Dashboard (from RAM)
- Edit live HTML and see changes immediately
Prerequisites:
Background:
The BigFix Windows Console has many fundamental parts that run an embedded “Web Browser Control” to display an HTML based UI and make use of JavaScript for dynamic content. These are not web pages or web based content and the HTML is all local. The “Web Browser Control” used is provided by Windows itself and is based upon Internet Explorer, but without the traditional UI or development tools that are accessible in a typical full Internet Explorer Browser window. This makes debugging JavaScript and HTML within the Console, generally in the form of a Console Dashobard quite difficult as you can’t see the JavaScript Console output that is useful for error messages and diagnosing problems.
The solution is to use Visual Studio in Script code debugging mode to access the underlying JavaScript Console of the embedded Internet Explorer based Web Browser Control.
Steps:
- Download Visual Studio for Windows (2017+)
- If used for Educational, Non-Profit, or Open Source, then Visual Studio Community Edition is free.
- Otherwise, use a Visual Studio Subscription or similar licensed version.
- https://visualstudio.microsoft.com/downloads/
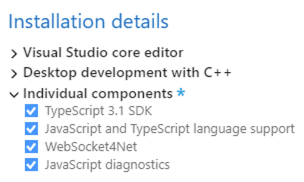
- Install Visual Studio with Javascript components
- Follow Steps here:
- https://weblog.west-wind.com/posts/2017/Jul/06/JavaScript-Debugging-in-a-Web-Browser-Control-with-Visual-Studio
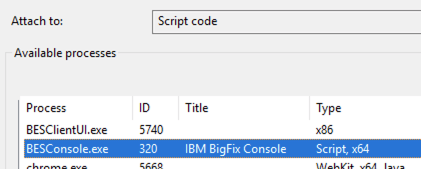
- Attach to Process
BESConsole.exe- NOTE: Must be
Attach to: Script code
- NOTE: Must be
- Add JavaScript Console Window if missing (Debug -> Windows -> JavaScript Console)
Next:
Related:
- https://weblog.west-wind.com/posts/2017/Jul/06/JavaScript-Debugging-in-a-Web-Browser-Control-with-Visual-Studio